With Covid-19 raging globally, the prices of blood oximeters have also started to rise, following masks, antigens, and drugs. More and more families are paying attention to monitoring blood oxygen saturation, and oximeter have shifted from professional medical electronic products to household medical products.
So, how does this type of household electronic oximeter work? Is the measurement data accurate or not? Today, I will take everyone to analyze.
Working principle of oximeters
A blood oximeter is a medical device that monitors indicators such as pulse and blood oxygen saturation. Common household types of blood oximeter mainly include finger clip and wrist watch types.
The most important thing that people generally pay attention to is blood oxygen saturation (SpO2), which refers to the percentage of combined O2 volume in the total blood volume that can be combined, and is an important reference value for the human body’s ability to carry oxygen. The normal SpO2 in the human body should not be less than 95%, and long-term SpO2 below 93% requires medical attention.
SpO2 is generally calculated by the following formula:

Among them, CHbO2 is the concentration of oxygenated hemoglobin, and CHb is the concentration of reduced hemoglobin.
On the one hand, these two types of hemoglobin have different absorbances for light of different wavelengths; On the other hand, when an artery beats, the amount of blood in the artery changes, which can distinguish the effects of skin, muscle, venous blood, etc. on light absorption (the absorption of light by these tissues can be considered fixed and unchanging). Therefore, by using two different wavelengths of light, transmitted or reflected, and collecting data for comprehensive processing, the bleeding oxygen saturation can be calculated.
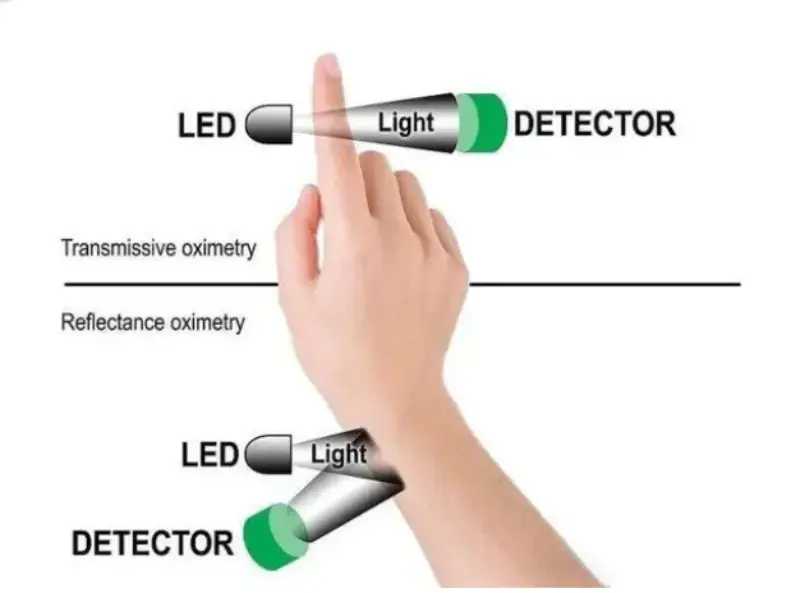
The most common methods on the market now are photoelectric oximeter, as shown in the following figure, which can be achieved through two methods: transmission and reflection.
The common finger clip oximeter is a transmission type, while a smart bracelet or watch is a reflection type, with similar principles.
The selection of LED light sources is related to the absorbance of hemoglobin at different wavelengths of light. The following figure shows the extinction coefficients of two types of hemoglobin at different wavelengths of light:
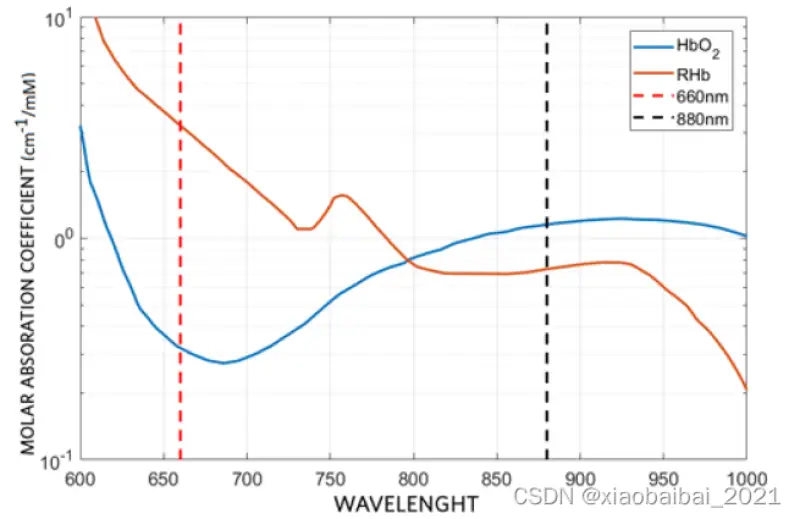
It can be seen that the two types of hemoglobin have the greatest difference in absorption of light with a wavelength of around 660nm, while their absorption of light with a wavelength of 800nm is basically equal. In theory, using light with wavelengths of 660nm and 800nm as the light source is the most suitable. However, due to the significant difference in extinction coefficient slopes between the two at around 800nm, a slight deviation in light wavelength can cause significant absorption rate changes, which requires too high manufacturing technology for LEDs. Therefore, in engineering implementation, LED with wavelengths of 860nm~920nm is generally not used, and LED with wavelengths of 860nm~920nm is chosen as another light source, The slope of the extinction coefficient in this range is basically the same, and the change is gentle.
Okay, so far, we have a rough understanding of the hardware implementation. The core is to use two LEDs as light sources, one with a wavelength of 660nm infrared light and one with a wavelength of around 900nm red light. After passing through (or reflecting) the skin, the two beams of light respectively reach the photoelectric receiving tube, and then collect the values of the photoelectric receiving tube.
So what should be done after collecting the values of two light sources? Due to the numerous formula derivations here, we will skip directly and provide the following formula:
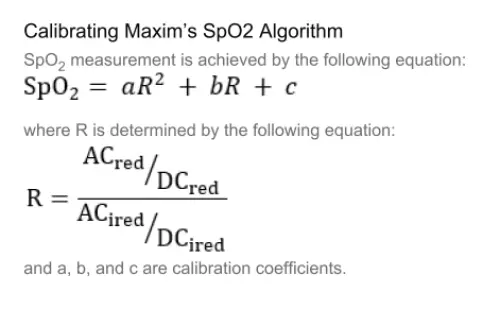
The implementation here requires three steps:
- Firstly, the values of the two LED light sources we collected need to separate the DC and AC components, namely: the AC component of red light ACred, the DC component of red light DCred, the AC component of infrared light ACred, and the DC component of infrared light DCred;
- Secondly, use the four collected values to calculate R;
- Finally, calculate SpO2 using R, where a, b, and c are the three parameters that need to be calibrated. A large amount of experimental data is needed to fit it.
DIY Oximeter
With the above theoretical foundation, we can DIY a blood oximeter ourselves.
There are many integrated chips for oximeter in the market now, and we can purchase any one. Here, I choose MAX30102.
MAX30102 integrates a 660nm red LED, an 880nm infrared LED, a photodetector, and a low noise electronic circuit with ambient light suppression. The chip contains an 18bit ADC acquisition circuit inside. Externally, it is an I2C interface. Basically, a single chip can achieve the collection of light source signals.
Please note that the output value of MAX30102 is only the collected value of two LED light sources. In the future, software is also needed to achieve the separation of AC and DC, the solution of R, and the solution of SpO2. The pulse data can also be solved by passing.
Using max30102 is very simple, accessed through the I2C interface, and the initialization code is as follows:
max30102_Bus_Write(REG_INTR_ENABLE_1,0xc0); // INTR setting
max30102_Bus_Write(REG_INTR_ENABLE_2,0x00);
max30102_Bus_Write(REG_FIFO_WR_PTR,0x00); //FIFO_WR_PTR[4:0]
max30102_Bus_Write(REG_OVF_COUNTER,0x00); //OVF_COUNTER[4:0]
max30102_Bus_Write(REG_FIFO_RD_PTR,0x00); //FIFO_RD_PTR[4:0]
max30102_Bus_Write(REG_FIFO_CONFIG,0x0f); //sample avg = 1, fifo rollover=false, fifo almost full = 17
max30102_Bus_Write(REG_MODE_CONFIG,0x03); //0x02 for Red only, 0x03 for SpO2 mode 0x07 multimode LED
max30102_Bus_Write(REG_SPO2_CONFIG,0x27); // SPO2_ADC range = 4096nA, SPO2 sample rate (100 Hz), LED pulseWidth (400uS)
max30102_Bus_Write(REG_LED1_PA,0x24); //Choose value for ~ 7mA for LED1
max30102_Bus_Write(REG_LED2_PA,0x24); // Choose value for ~ 7mA for LED2
max30102_Bus_Write(REG_PILOT_PA,0x7f); // Choose value for ~ 25mA for Pilot LED
In the main function, loop through the fifo read function to obtain the collected values of the LED light source:
void maxim_max30102_read_fifo(uint32_t *pun_red_led, uint32_t *pun_ir_led)
{
uint32_t un_temp;
unsigned char uch_temp;
char ach_i2c_data[6];
*pun_red_led=0;
*pun_ir_led=0;
//read and clear status register
maxim_max30102_read_reg(REG_INTR_STATUS_1, &uch_temp);
maxim_max30102_read_reg(REG_INTR_STATUS_2, &uch_temp);
IIC_ReadBytes(I2C_WRITE_ADDR,REG_FIFO_DATA,(u8 *)ach_i2c_data,6);
un_temp=(unsigned char) ach_i2c_data[0];
un_temp<<=16;
*pun_red_led+=un_temp;
un_temp=(unsigned char) ach_i2c_data[1];
un_temp<<=8;
*pun_red_led+=un_temp;
un_temp=(unsigned char) ach_i2c_data[2];
*pun_red_led+=un_temp;
un_temp=(unsigned char) ach_i2c_data[3];
un_temp<<=16;
*pun_ir_led+=un_temp;
un_temp=(unsigned char) ach_i2c_data[4];
un_temp<<=8;
*pun_ir_led+=un_temp;
un_temp=(unsigned char) ach_i2c_data[5];
*pun_ir_led+=un_temp;
*pun_red_led&=0x03FFFF; //Mask MSB [23:18]
*pun_ir_led&=0x03FFFF; //Mask MSB [23:18]
}
It is best to filter the collected values to reduce noise interference.
Afterwards, separate the AC and DC components, and calculate R and SpO2. The core is this function:
Void maxim_heart_rate_and_oxygen_saturation(uint32_t *pun_ir_buffer, int32_t n_ir_buffer_length, uint32_t *pun_red_buffer, int32_t *pn_spo2, int8_t *pch_spo2_valid, int32_t *pn_heart_rate, int8_t *pch_hr_valid)
{
uint32_t un_ir_mean ,un_only_once ;
int32_t k ,n_i_ratio_count;
int32_t i, s, m, n_exact_ir_valley_locs_count ,n_middle_idx;
int32_t n_th1, n_npks,n_c_min;
int32_t an_ir_valley_locs[15] ;
int32_t an_exact_ir_valley_locs[15] ;
int32_t an_dx_peak_locs[15] ;
int32_t n_peak_interval_sum;
int32_t n_y_ac, n_x_ac;
int32_t n_spo2_calc;
int32_t n_y_dc_max, n_x_dc_max;
int32_t n_y_dc_max_idx, n_x_dc_max_idx;
int32_t an_ratio[5],n_ratio_average;
int32_t n_nume, n_denom ;
// remove DC of ir signal
un_ir_mean =0;
for (k=0 ; k<n_ir_buffer_length ; k++ ) un_ir_mean += pun_ir_buffer[k] ;
un_ir_mean =un_ir_mean/n_ir_buffer_length ;
for (k=0 ; k<n_ir_buffer_length ; k++ ) an_x[k] = pun_ir_buffer[k] – un_ir_mean ;
// 4 pt Moving Average
for(k=0; k< BUFFER_SIZE-MA4_SIZE; k++){
n_denom= ( an_x[k]+an_x[k+1]+ an_x[k+2]+ an_x[k+3]);
an_x[k]= n_denom/(int32_t)4;
}
// get difference of smoothed IR signal
for( k=0; k<BUFFER_SIZE-MA4_SIZE-1; k++)
an_dx[k]= (an_x[k+1]- an_x[k]);
// 2-pt Moving Average to an_dx
for(k=0; k< BUFFER_SIZE-MA4_SIZE-2; k++){
an_dx[k] = ( an_dx[k]+an_dx[k+1])/2 ;
}
// hamming window
// flip wave form so that we can detect valley with peak detector
for ( i=0 ; i<BUFFER_SIZE-HAMMING_SIZE-MA4_SIZE-2 ;i++){
s= 0;
for( k=i; k<i+ HAMMING_SIZE ;k++){
s -= an_dx[k] *auw_hamm[k-i] ;
}
an_dx[i]= s/ (int32_t)1146; // divide by sum of auw_hamm
}
n_th1=0; // threshold calculation
for ( k=0 ; k<BUFFER_SIZE-HAMMING_SIZE ;k++){
n_th1 += ((an_dx[k]>0)? an_dx[k] : ((int32_t)0-an_dx[k])) ;
}
n_th1= n_th1/ ( BUFFER_SIZE-HAMMING_SIZE);
// peak location is acutally index for sharpest location of raw signal since we flipped the signal
maxim_find_peaks( an_dx_peak_locs, &n_npks, an_dx, BUFFER_SIZE-HAMMING_SIZE, n_th1, 8, 5 );
//peak_height, peak_distance, max_num_peaks
n_peak_interval_sum =0;
if (n_npks>=2){
for (k=1; k<n_npks; k++)
n_peak_interval_sum += (an_dx_peak_locs[k]-an_dx_peak_locs[k -1]);
n_peak_interval_sum=n_peak_interval_sum/(n_npks-1);
*pn_heart_rate=(int32_t)(6000/n_peak_interval_sum);// beats per minutes
*pch_hr_valid = 1;
}
else {
*pn_heart_rate = -999;
*pch_hr_valid = 0;
}
for ( k=0 ; k<n_npks ;k++)
an_ir_valley_locs[k]=an_dx_peak_locs[k]+HAMMING_SIZE/2;
// raw value : RED(=y) and IR(=X)
// we need to assess DC and AC value of ir and red PPG.
for (k=0 ; k<n_ir_buffer_length ; k++ ) {
an_x[k] = pun_ir_buffer[k] ;
an_y[k] = pun_red_buffer[k] ;
}
// find precise min near an_ir_valley_locs
n_exact_ir_valley_locs_count =0;
for(k=0 ; k<n_npks ;k++){
un_only_once =1;
m=an_ir_valley_locs[k];
n_c_min= 16777216;//2^24;
if (m+5 < BUFFER_SIZE-HAMMING_SIZE && m-5 >0){
for(i= m-5;i<m+5; i++)
if (an_x[i]<n_c_min){
if (un_only_once >0){
un_only_once =0;
}
n_c_min= an_x[i] ;
an_exact_ir_valley_locs[k]=i;
}
if (un_only_once ==0)
n_exact_ir_valley_locs_count ++ ;
}
}
if (n_exact_ir_valley_locs_count <2 ){
*pn_spo2 = -999 ; // do not use SPO2 since signal ratio is out of range
*pch_spo2_valid = 0;
return;
}
// 4 pt MA
for(k=0; k< BUFFER_SIZE-MA4_SIZE; k++){
an_x[k]=( an_x[k]+an_x[k+1]+ an_x[k+2]+ an_x[k+3])/(int32_t)4;
an_y[k]=( an_y[k]+an_y[k+1]+ an_y[k+2]+ an_y[k+3])/(int32_t)4;
}
//using an_exact_ir_valley_locs , find ir-red DC andir-red AC for SPO2 calibration ratio
//finding AC/DC maximum of raw ir * red between two valley locations
n_ratio_average =0;
n_i_ratio_count =0;
for(k=0; k< 5; k++) an_ratio[k]=0;
for (k=0; k< n_exact_ir_valley_locs_count; k++){
if (an_exact_ir_valley_locs[k] > BUFFER_SIZE ){
*pn_spo2 = -999 ; // do not use SPO2 since valley loc is out of range
*pch_spo2_valid = 0;
return;
}
}
// find max between two valley locations
// and use ratio betwen AC compoent of Ir & Red and DC compoent of Ir & Red for SPO2
for (k=0; k< n_exact_ir_valley_locs_count-1; k++){
n_y_dc_max= -16777216 ;
n_x_dc_max= – 16777216;
if (an_exact_ir_valley_locs[k+1]-an_exact_ir_valley_locs[k] >10){
for (i=an_exact_ir_valley_locs[k]; i< an_exact_ir_valley_locs[k+1]; i++){
if (an_x[i]> n_x_dc_max) {n_x_dc_max =an_x[i];n_x_dc_max_idx =i; }
if (an_y[i]> n_y_dc_max) {n_y_dc_max =an_y[i];n_y_dc_max_idx=i;}
}
n_y_ac= (an_y[an_exact_ir_valley_locs[k+1]] – an_y[an_exact_ir_valley_locs[k] ] )*(n_y_dc_max_idx -an_exact_ir_valley_locs[k]); //red
n_y_ac= an_y[an_exact_ir_valley_locs[k]] + n_y_ac/ (an_exact_ir_valley_locs[k+1] – an_exact_ir_valley_locs[k]) ;
n_y_ac= an_y[n_y_dc_max_idx] – n_y_ac; // subracting linear DC compoenents from raw
n_x_ac= (an_x[an_exact_ir_valley_locs[k+1]] – an_x[an_exact_ir_valley_locs[k] ] )*(n_x_dc_max_idx -an_exact_ir_valley_locs[k]); // ir
n_x_ac= an_x[an_exact_ir_valley_locs[k]] + n_x_ac/ (an_exact_ir_valley_locs[k+1] – an_exact_ir_valley_locs[k]);
n_x_ac= an_x[n_y_dc_max_idx] – n_x_ac; // subracting linear DC compoenents from raw
n_nume=( n_y_ac *n_x_dc_max)>>7 ; //prepare X100 to preserve floating value
n_denom= ( n_x_ac *n_y_dc_max)>>7;
if (n_denom>0 && n_i_ratio_count <5 && n_nume != 0)
{
an_ratio[n_i_ratio_count]= (n_nume*20)/n_denom ; //formular is ( n_y_ac *n_x_dc_max) / ( n_x_ac *n_y_dc_max) ; ///*************************n_nume原来是*100************************//
n_i_ratio_count++;
}
}
}
maxim_sort_ascend(an_ratio, n_i_ratio_count);
n_middle_idx= n_i_ratio_count/2;
if (n_middle_idx >1)
n_ratio_average =( an_ratio[n_middle_idx-1] +an_ratio[n_middle_idx])/2; // use median
else
n_ratio_average = an_ratio[n_middle_idx ];
if( n_ratio_average>2 && n_ratio_average <184){
n_spo2_calc= uch_spo2_table[n_ratio_average] ;
*pn_spo2 = n_spo2_calc ;
*pch_spo2_valid = 1;// float_SPO2 = -45.060*n_ratio_average* n_ratio_average/10000 + 30.354 *n_ratio_average/100 + 94.845 ; // for comparison with table
}
else{
*pn_spo2 = -999 ; // do not use SPO2 since signal ratio is out of range
*pch_spo2_valid = 0;
}
}
Note that the function used here is SpO2=-45.060 * R * R+30.354 * R+94.845, solved using the lookup table method.
After executing this function, the variable n_ Heart_ The rate stores the heart rate and the variable n_ SP02 stores blood oxygen saturation;
Finally, just display the blood oxygen saturation value.
(For complete engineering codes, please contact us)
Is the measurement accuracy of the oximeter accurate?
During the implementation process, the coefficient of the relationship between SpO2 and R is very difficult to determine and requires a large amount of experimental data to fit, as shown in the following figure, which is the fitting process in the application document of MOKOMEDTECH company:
(Each color is a set of test results, and the yellow cross is the outlier with significant deviation removed)
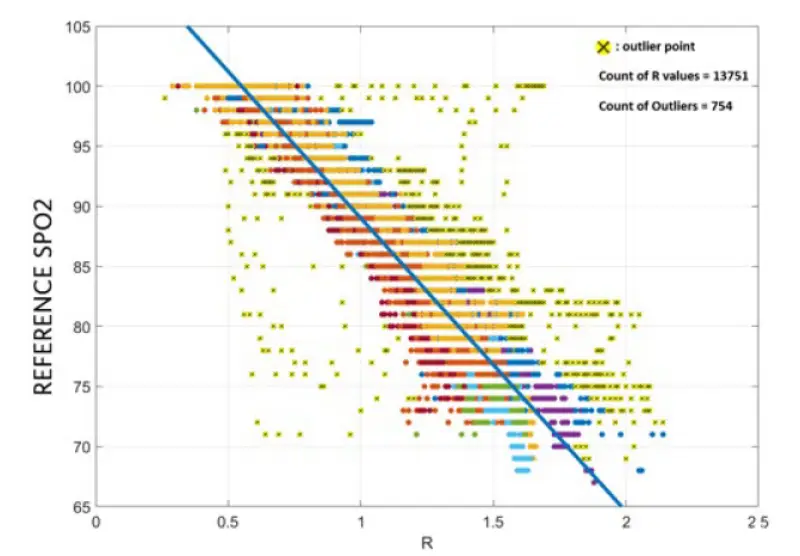
It can be found that the variance of some measurement data is quite large, and many data deviate far from the fitted curve. MOKOMEDTECH company suggests that on time for calibration, it is necessary to continuously eliminate data with significant deviations, and the root mean square error (RMES) should be within 3.5%.
Finally, a set of values is given:

However, in some companies’ application documents, the formula SpO=104-17 * R is given, where 0.4<R<3.4.
Why are these two formulas so different?
After reviewing some papers, it was found that the formula for the relationship between R value and blood oxygen saturation is not fixed. SpO2 can be expressed as a higher order polynomial function of R. Due to the small R values measured in normal humans, people generally pay attention to situations where the R value is less than 1. A value greater than 1 is already an obvious unhealthy condition. So when calculating SpO2, high-order terms are often removed and first-order or second-order functions are used to fit.
Due to the large error of the SpO2 measurement method itself, the fitted parameters vary greatly when the measurement data is different.
Here, I also collected the functional relationships between the fitted R values and SpO2 in several papers:
- SpO2 = -45.060*R*R+ 30.354*R+ 94.845;
- SpO2 = -7.6*R*- 20.7*R+ 112.2;(0.5<R<1.4)
- SpO2 = -86.47*R*R+ 77.21*R+ 81.68,(0.4<R<1);
- SpO2 = -20*x+107.2,(0.36<R<0.66);-54*x+129.64,(0.66≤R<1)
I drew the graphs of these functions on the same graph:
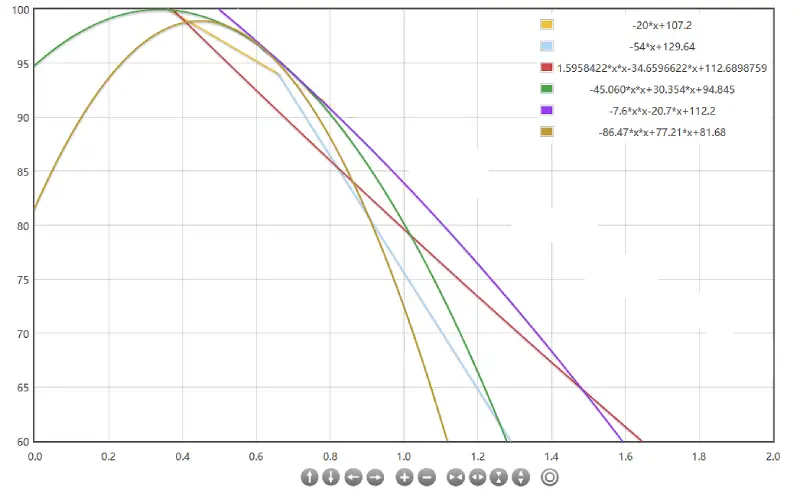
It can be seen that in the range of R from 0.4 to 1.0, the values of these functions generally do not differ much, and the trend of change is also basically the same. Moreover, these parameters are generally fitted with data from normal individuals, so within the range of normal blood oxygen, it can be considered that measuring blood oxygen saturation using this method is basically reliable. When the blood oxygen saturation deviates from the normal value, the error will significantly increase.
Of course, this needs to be established on the premise that the collected data of the light source is accurate, that is, when the R value is accurate.
The reality is that when collecting data from light sources, there will be environmental light interference, power frequency interference, and various types of noise interference; Even if these noises are filtered out, there will still be low-frequency drift as shown in the figure below. At this time, it is very difficult to accurately extract the DC and AC components of the light source.
Therefore, if the signal processing algorithm is not good, weak noise, drift, and other interferences will be identified as changes in light intensity caused by pulse. It is not surprising that various jokes that can measure the blood oxygen and pulse of sausages appear online.
Overall, this type of oximeter can be used as one of the reference methods for health monitoring, but the accuracy of the data is questionable, and it is absolutely impossible to use it to determine whether the body is healthy.

